When it comes to
our approach, our partners, and our services –
it’s all personal.
Joining your team on the journey, wherever it begins.
Our goal is to help you gain time back and tackle that endless to-do list by getting to the heart of every challenge, working together to remove obstacles, and formulating a system to get it all done the right way.
We’re human beings first, and we’re deeply invested in cultivating a real relationship built on transparency and shared vision. And as a brother-sister duo, we aim to make our clients feel like part of an extended family in the process.
We don’t believe in one-size-fits-all marketing. Whether you’re building your brand from the ground up or scaling toward new heights, we meet you where you are and bring the right tools to move you forward.
Storytelling
Start with the soul of your brand.
We dig deep to uncover the story that sets you apart and speaks directly to your ideal buyer.
Includes: Brand Identity, Messaging & Positioning, and Buyer Persona Development.
Perfect for leaders who are:
→ Defining their voice
→ Managing a rebrand
→ Investing in audience research
→ Struggling to articulate what makes them different
Attracting
Put that story in front of the right people.
We create and launch strategic, creative campaigns that connect emotionally and convert intentionally.
Includes: Campaign Strategy, Multi-Channel Planning, Creative Design, and Digital Visibility.
Perfect for brands who are:
→ Launching something new
→ Struggling to reach and convert ideal buyers
→ Wanting a refreshed look and presence
→ Ready to scale demand across platforms
Growing
Fuel momentum with data and refinement.
We optimize what’s working, automate what’s repeatable, and deepen brand loyalty with clear, measurable strategy.
Includes: Lead Nurturing, HubSpot Automation, Engagement Reporting, Retention Strategy.
Perfect for brands who are:
→ Looking to increase mROI
→ Aligning marketing with revenue goals
→ Optimizing active campaigns
→ Focusing on long-term growth and retention
Want the big picture?
We’ve honed this framework over 17+ years of adapting to market shifts and it works because we flex where you need us most. Every engagement starts with strategy, and builds toward scalable, sustainable results.
Your Story
Your Vision
Your Message
Your Reach
Your Engine
Your Voice
Your Audience
Your Image
Our Roadmap
Marketing Research
Brand Guidelines
Videography
Animations
Photography
Graphic Design
Advertising
Maintain & Reporting
Marketing Research
“We are Strategists”
“The Aliste team blew my mind! They performed work, audits and came up with solutions to problems I didn’t even know we had. They are so thorough in the work they do! They hit the mark each time when it comes to strategy, messaging, and delivering! They genuinely feel like a part of my internal team and have exceeded my marketing firm expectations.”
CEO & Founder
Lauren Fitzpatrick-Shanks
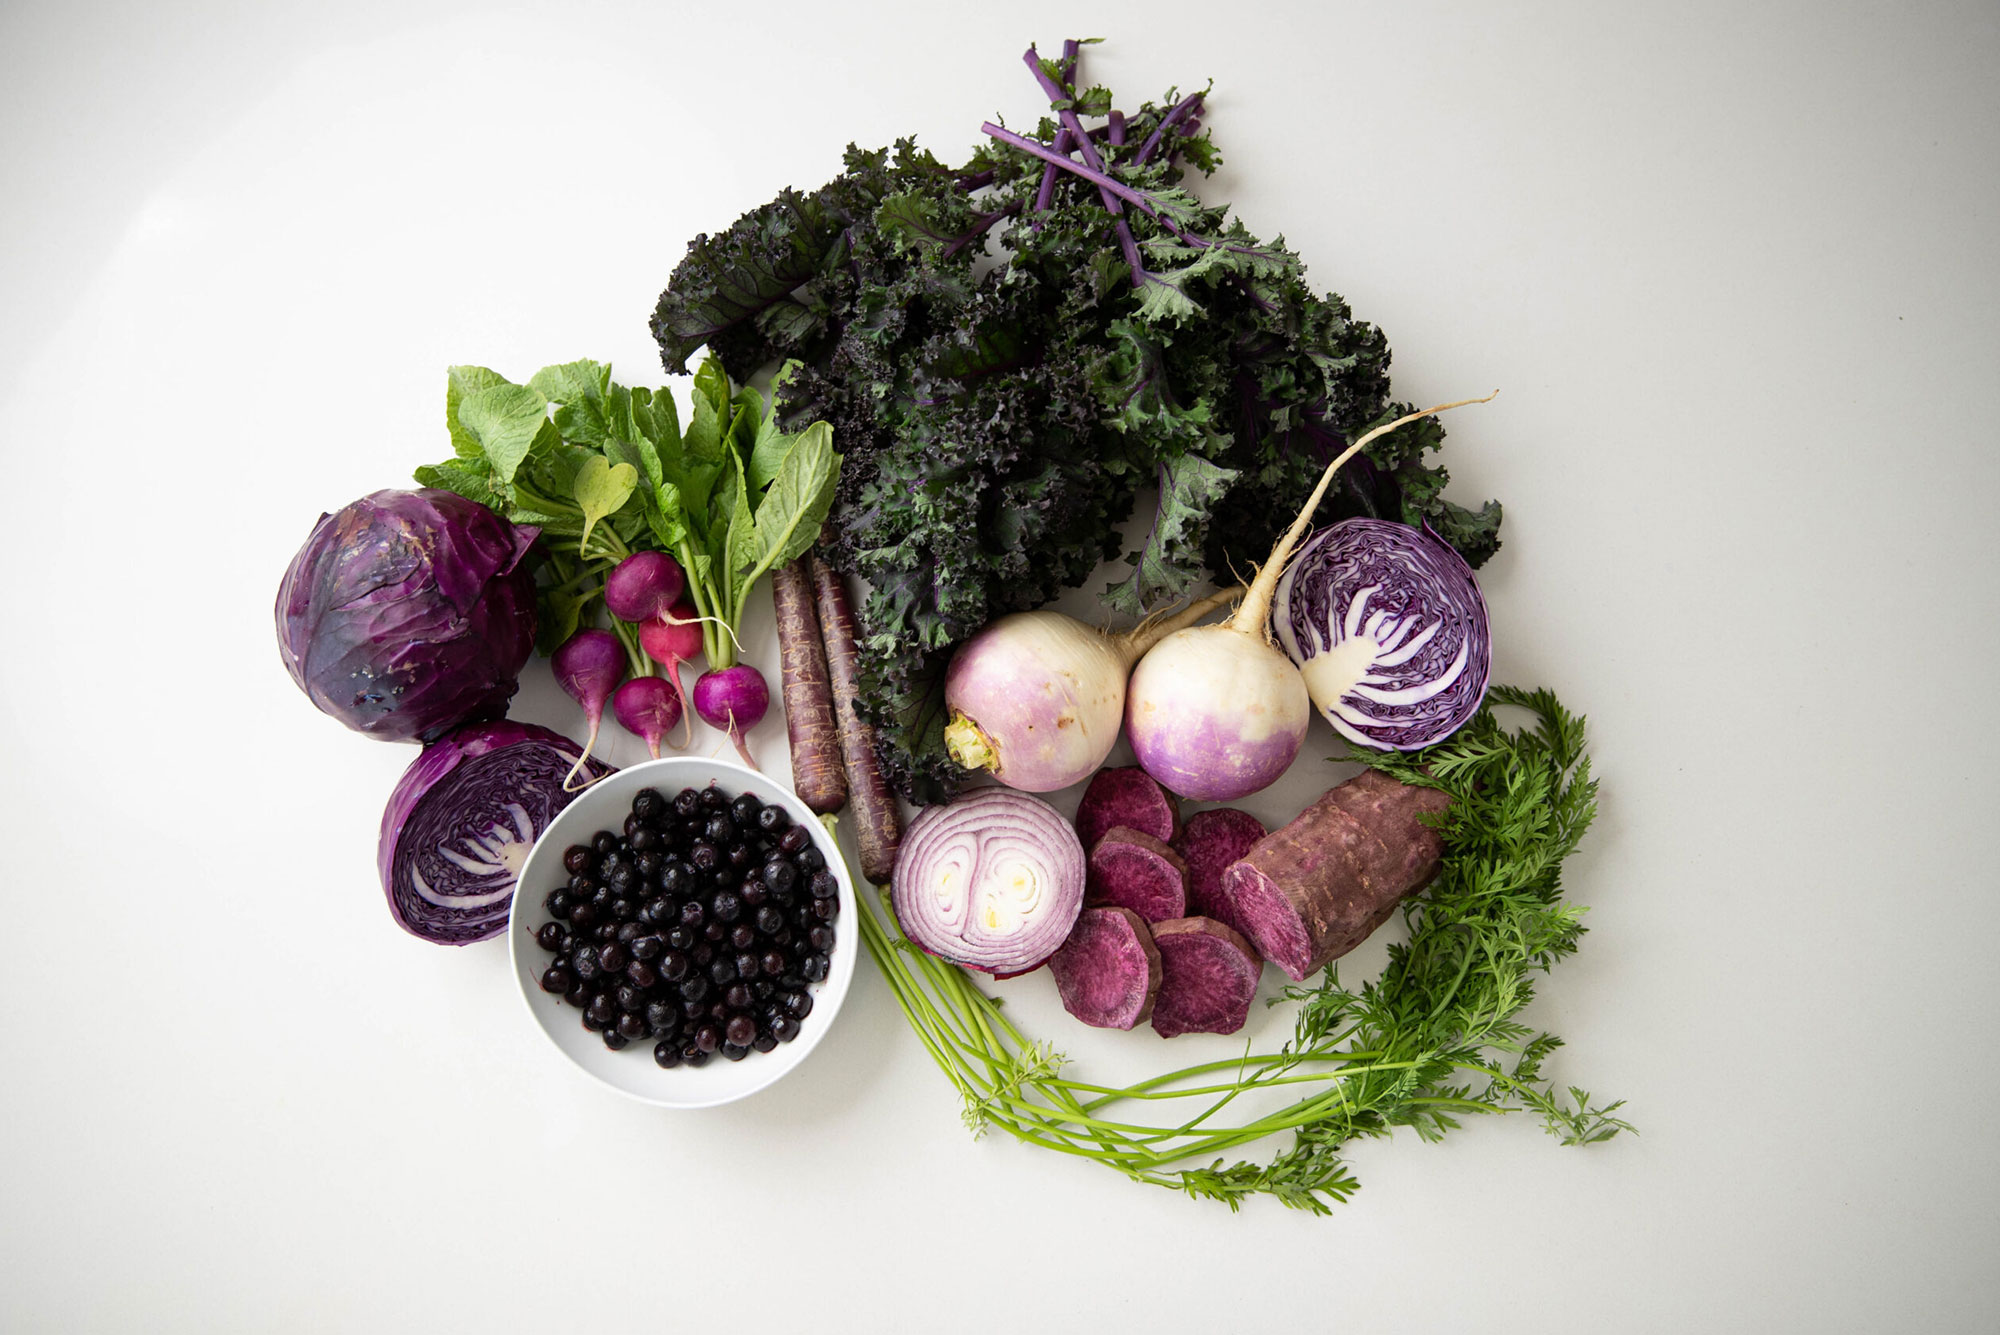
creative solutions that support your vision
Graphic Design
“We are Innovative”
“The team is organized, thorough, creative, pays attention to detail, and produces high quality work.”
Founder Kids in Tech
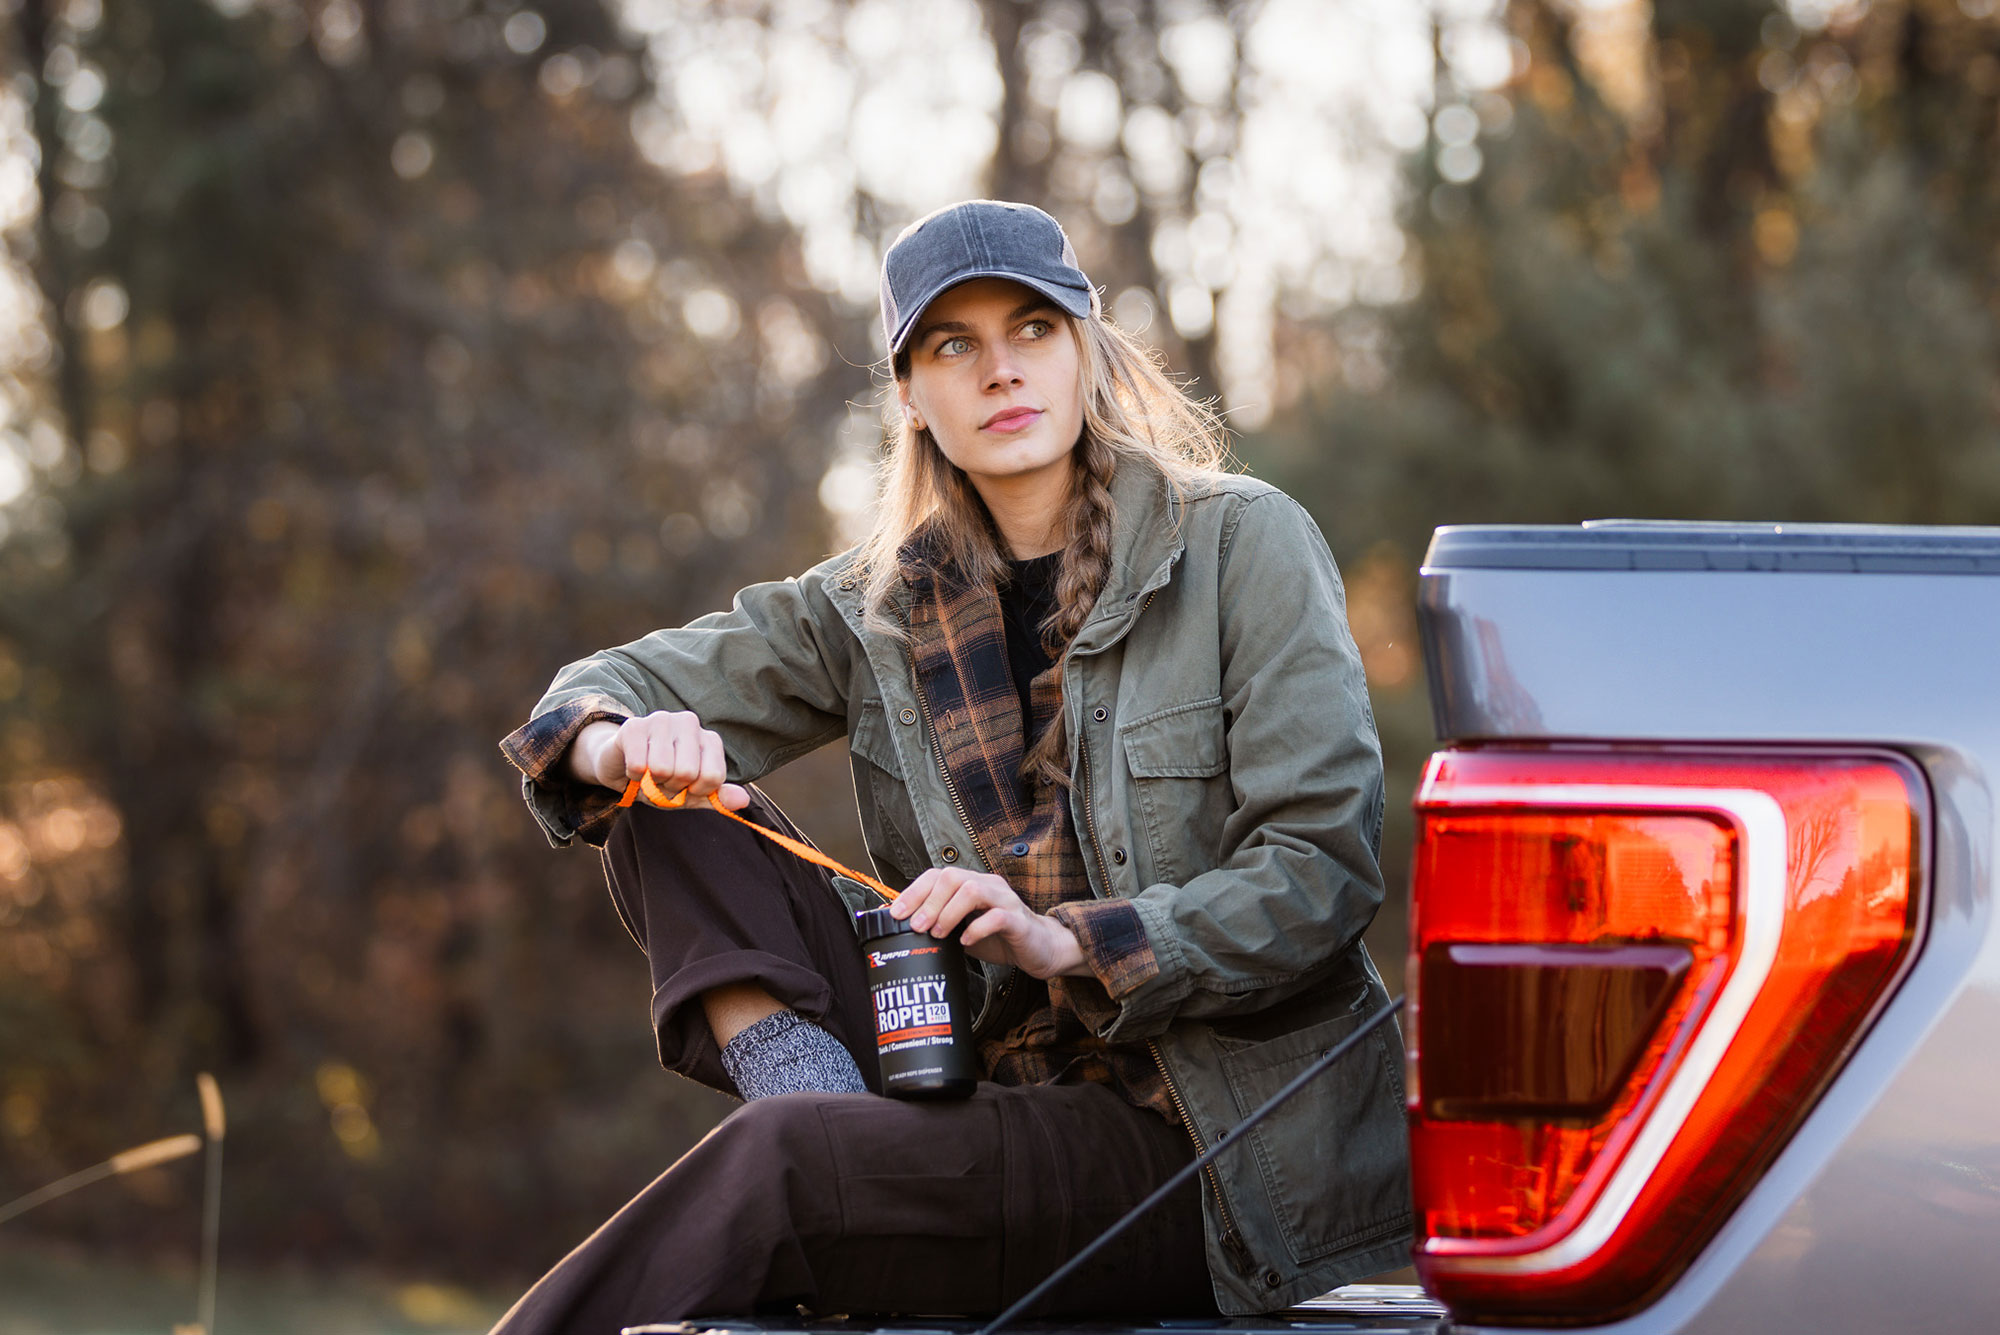
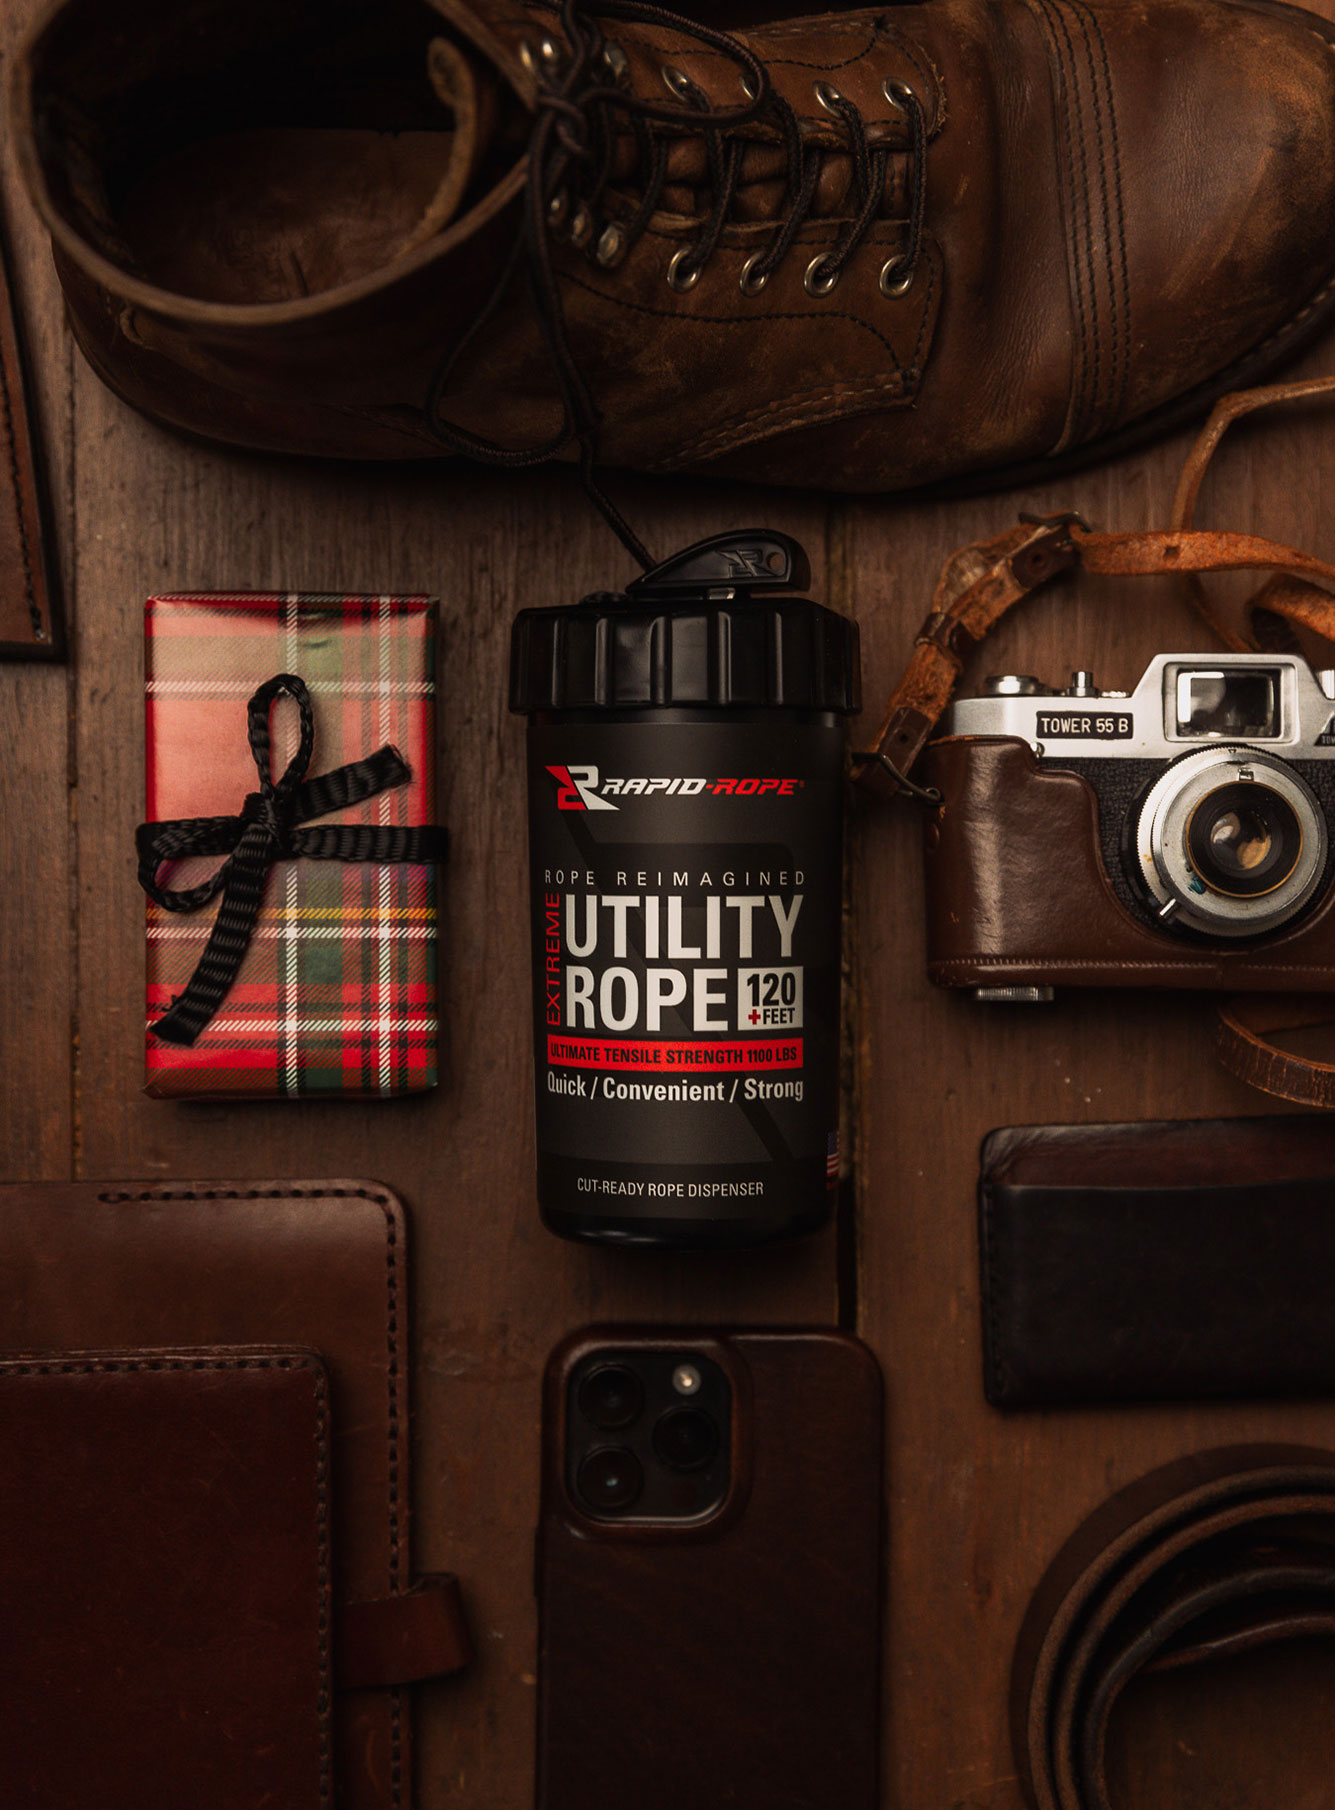
Videography
“We are Storytellers”
“We needed a product video created from script to final production, in a fairly quick turn around. Alicia and Dan were fantastic partners on the project. They found a location, hired talent, wrote a script and shot the video. My marketing team was very happy with the work. They did a great job making our product and brand look very professional by creating the video on time for a large retailer’s virtual trade show.”
Helen of Troy
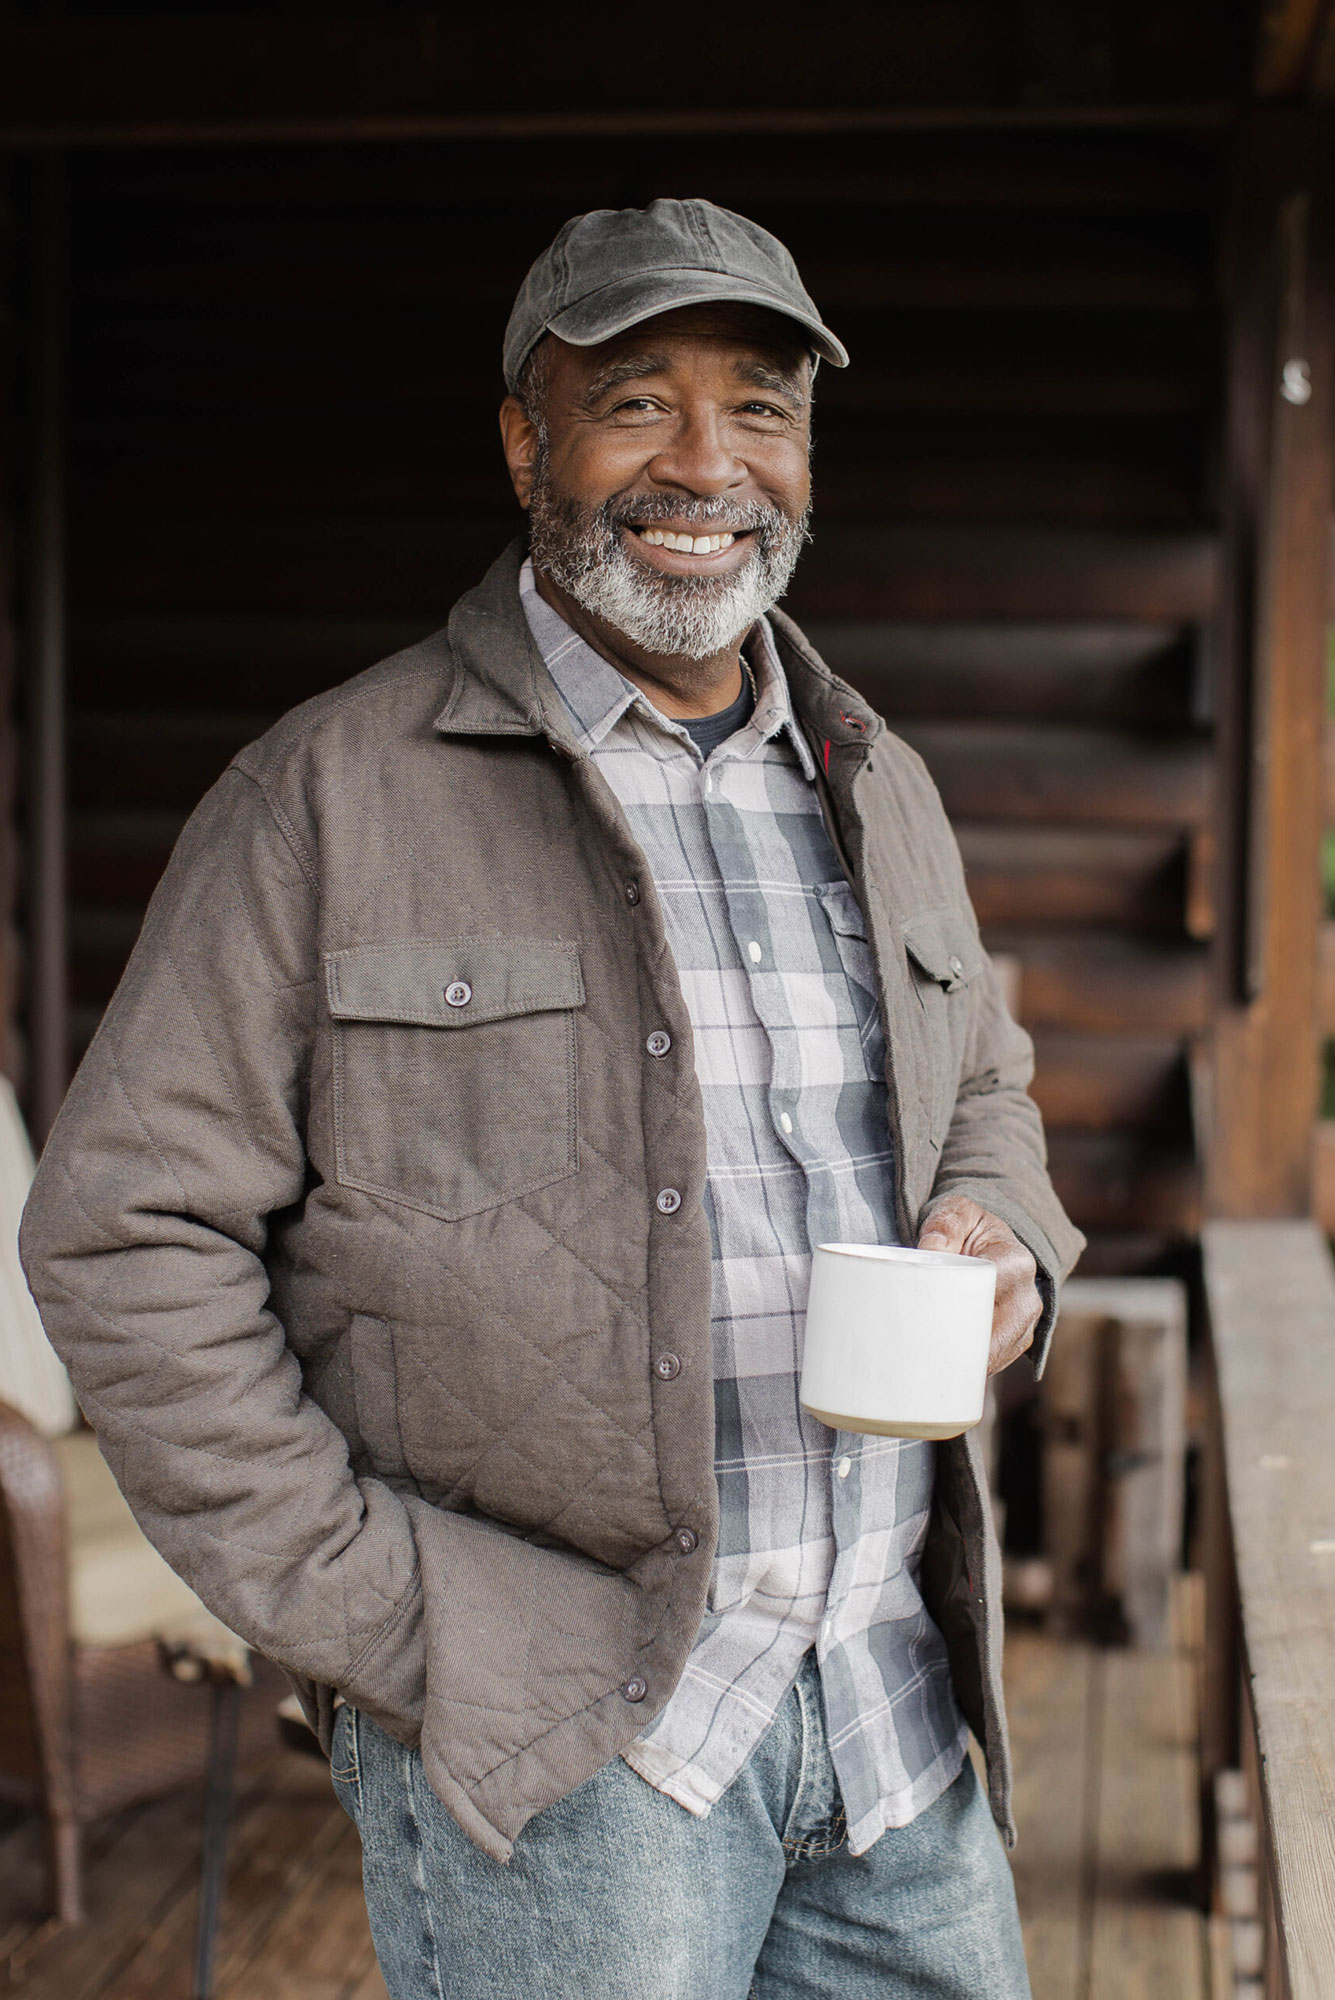
Photography
“We are Authentic”
“From the moment we first started having conversations, right up to today, Aliste Marketing has been and continues to be an absolute joy to work with. They are very positive, upbeat and enthusiastic in how they approach projects we give them. No is not an option with them as they always find a way to make it work.”
Access Manufacturing Solutions